Why an accurate AI gets switched off on the ward
By Reza Motaghi
On this page
In 1978 a Harvard team put one question to sixty medical students and doctors. A disease affects one person in a thousand, and the test for it flags 5 percent of healthy people by mistake. A patient has just tested positive. How likely is it that the patient is sick?
The right answer is about 2 percent. Eleven of the sixty got it right, and the most common answer was 95 percent.
In July 2013 a Boston group put the same question to 61 people at one hospital and published the result in JAMA Internal Medicine.1 Fourteen got it right. The most common answer was still 95 percent, and the median answer was 66 percent. It was a convenience sample with no response rate given, and the same wrong number had survived thirty-five years.
The same arithmetic sits inside every medical AI brochure. Sensitivity and specificity belong to the tool. How often an alarm is true belongs to the ward, and it falls as the disease gets rarer in the people who walk in. A buyer who does not run the sum has answered 95 percent, like the room in Boston.
This is for the hospital leader signing the next pilot and the founder whose deck says 95 percent accurate. It is also for anyone who bought software the staff quietly stopped using.
I run enterprise AI in production, as Chief Innovation Officer, and I read medical images every day. The tools that quietly stopped being used were the ones that cried wolf, not the ones that missed. Nobody switched them off for being wrong. People stopped answering because an answer cost more than it returned.
What the alarm bill is
The alarm bill is what a ward pays for a tool's alarms, and it has two factors. The first is the share of alarms that are false at your prevalence. The second is what one answered alarm costs: someone's minutes, a repeat scan, a transfer, a biopsy. Multiply the two and you have a number no brochure can print, because both factors belong to the ward.
A vendor's number is not a lie. It is an answer to a different question, asked on a test set the vendor chose. An AI tool that fills a missing fact with an average is the default patient. A buyer who reads accuracy as the alarm rate has done the same thing. The missing fact is the prevalence, and the average is the vendor's test set.
The four numbers below are how a working buyer fills that fact in. None of them needs a statistician. Three of them need a month of your own cases.
How prevalence turns 90 percent into seven false flags in ten
Sensitivity is the share of sick patients a tool flags. Specificity is the share of healthy ones it leaves alone. Both travel with the tool. The share of flags that are true does not travel, because it depends on how many sick people walk through your door.
A preprint posted in March 2026, by authors including a teleradiology group, read 57 recent regulator summaries covering 38 AI radiology tools.2 Fifty-two of them gave sensitivity and specificity. Six spelled out the share of flags that would be true. Eleven stated the prevalence of their test set outright, and another 29 let a reader work it out.
Its worked example is a stroke triage detector reported at 90.6 percent sensitivity and 88.8 percent specificity. Run it where about five patients in a hundred have the condition, and out of 100 flags about 71 are false.2 The preprint calls that number predicted, and the word matters. Nobody measured it in a clinic.
The prevalence behind it came from a 2017 study of ambulance stroke calls, not from any hospital's scanner.3 The detector's own clearance test set was about half positive. Run the same sum there and about one flag in ten is false. The true number in any hospital sits between the two, and nobody has published it.
So the tipping point is the number to hold. For those two inputs it is about 11 in 100: below that share of positives, more flags are false than true. That is arithmetic, not a finding, and it takes a minute on paper. It belongs with the other one-minute arithmetic worth doing before trusting an instrument.
Counts are not a style choice. In 1998 a study in Academic Medicine gave 48 physicians the same diagnosis problems as percentages and as counts.4 They got the answer right one time in ten as percentages and nearly half the time as counts. This article writes the bill as counts for that reason.
What happened to the people who answered the alarms
The best fresh evidence from radiology is about perception, and it is honest in both directions. In June 2026 a survey in JMIR Human Factors asked 65 teleradiologists about a cleared bleed detector.5 Twelve agreed its false alerts were rare enough to accept. Twenty-two said the time spent reviewing false alerts outweighed the benefit, which leaves two in three who did not say that.
One pathway shows the whole arc. An AI triage pathway for suspected lung cancer cut the wait from chest X-ray to CT from 6 days to 3.6.6 One month in, staff feedback had turned largely negative: workflow disruption, delays, false positives, frustrated patients. By month eight the views had become more balanced.
The pathway was withdrawn in 2025, and the report from the European Congress of Radiology gives no reason. The staff surveys behind it, in Clinical Radiology, name frustration with technical integration, not false alarms.7 The lesson its lead drew was responsible withdrawal: an exit plan agreed before adoption.
A Spanish screening trial in Nature Medicine this year shows what the endpoint does to the verdict.8 AI kept the low-risk exams away from the radiologists, workload fell 63.6 percent and cancer detection rose 15.2 percent. Recall rose 14.8 percent, so on that endpoint the strategy was not noninferior. The share of recalled women who turned out to have cancer did not move.
Read on detection the AI worked, read on recall it failed. The difference is which alarm the programme had agreed to pay for before it began.
The cleanest measurement of the mechanism comes from outside imaging. In a 2017 study of primary care decision support, each extra reminder in a visit cut the chance of acceptance by 30 percent.9 Repeated reminders cut it further. It found no numbing over time for a newly deployed alert: the bill is per alarm, not per month.
Outside medicine the switch-off is on record. At Google a code check shown to engineers may carry up to 10 percent effective false positives, defined as issues after which nobody took action.10 Past that ratio the platform team disables the check until its author improves it. A filter that flags wording rather than intent meets the same fate from below: the experts it interrupts route around it.
In Nepal a pilot had disabled his aircraft's terrain warning because it gave nuisance warnings, as the Flight Safety Foundation reported from the investigation.11 The aircraft struck a ridge with a single alert sounding, and all 22 aboard died. One crash is not a rate. It is what the switch looks like when someone finally throws it.
The field has run this experiment once
Computer-aided detection for screening mammography marked suspicious spots on the image for the radiologist to check. A study of 43 facilities in the New England Journal of Medicine in 2007 measured what happened when seven of them adopted it.12 Specificity fell from 90.2 to 87.2 percent. Biopsies rose 19.7 percent, and cancer detection did not change.
Eight years later a larger study in JAMA Internal Medicine found the tool improved no metric it measured.13 By then most screening mammograms in the United States ran through it, at a cost of over 400 million dollars a year. Nobody switched it off.
My reading of why is the alarm bill. The radiologist answered the marks inside a read she was paid for either way, and the extra biopsies landed on the women. The bill was paid on a desk that did not hold the switch. A tool survives its false alarms when the person who pays for them cannot turn it off.
The alarm bill, four numbers
These are the four numbers I demand before a tool that raises alarms meets a ward I am responsible for. Each carries its evidence and an off-ramp, the case where the check does not apply. One of them I changed after reading the evidence, and the check says so.
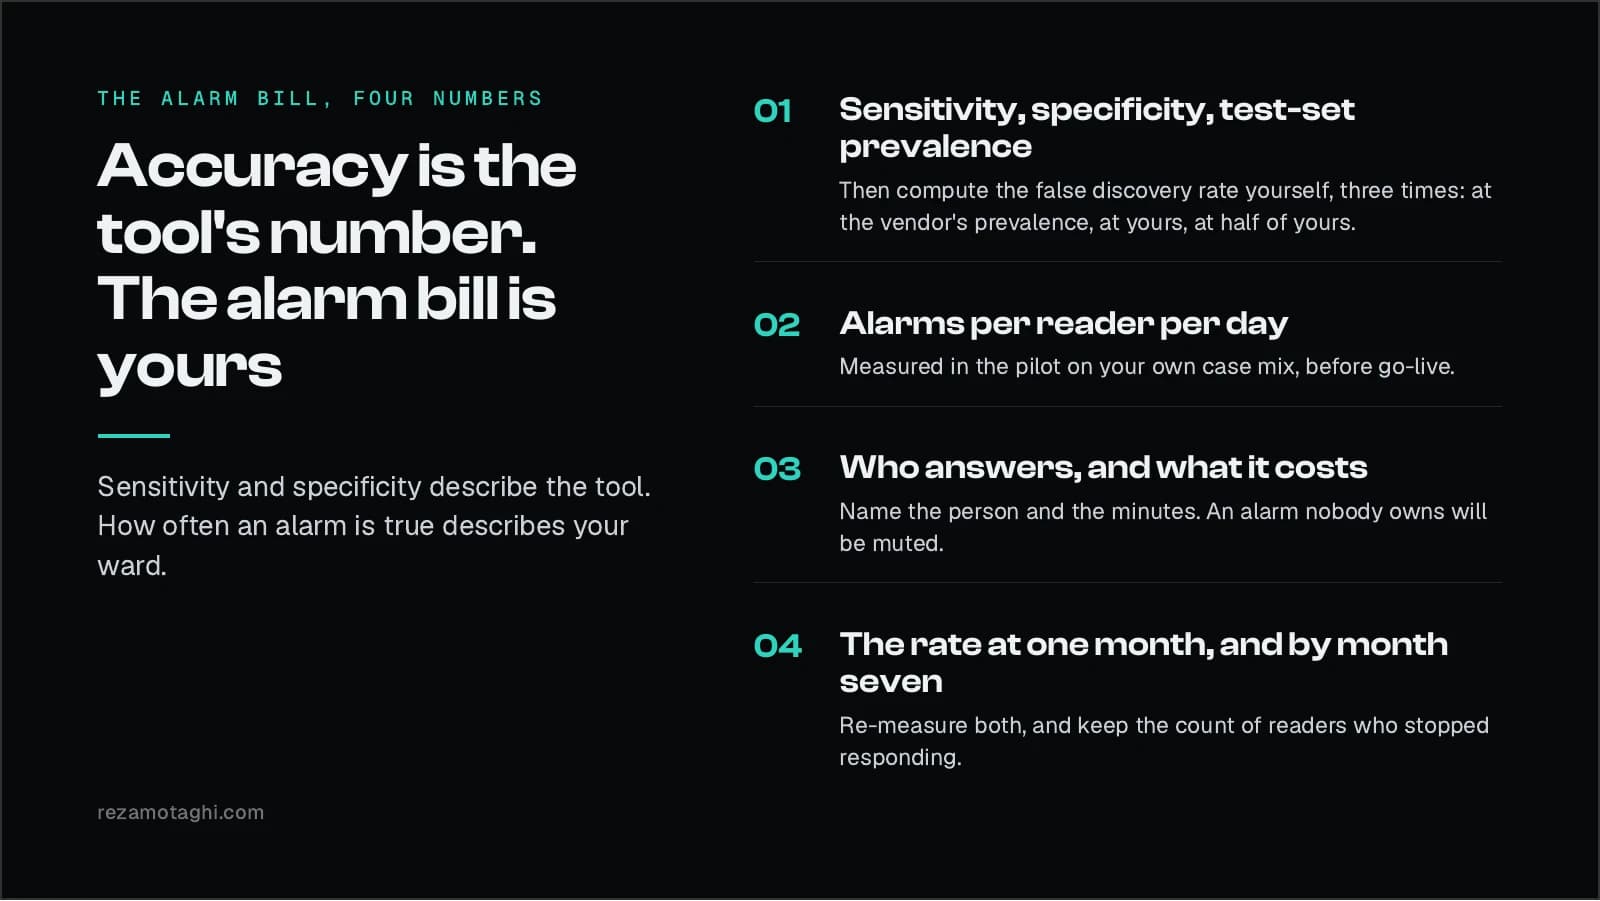
1. Sensitivity, specificity and the test-set prevalence, then the false share at three prevalences. Ask for all three. Then compute the false discovery rate yourself, three times: at the vendor's test-set prevalence, at your best estimate, and at half of it. This is the check that changed. My draft asked for one number, the false discovery rate at your prevalence. The evidence sent it back. The same detector swings from one false flag in ten to seven in ten on prevalence alone.2 The preprint's own number came from another population. One number misleads either way. Three show the slope, and the honest answer to what is my prevalence is usually measure it first. Off-ramp: a tool that raises no alarm has no bill. CBCTScope, the first CBCT viewer with native AI-agent control, gives the agent navigation verbs and none that returns a finding. There is nothing to price. The check is for tools that speak.
2. Alarms per reader per day, measured in the pilot on your own cases. Count them before go-live, on your own consecutive cases, not on a set the vendor supplied. The primary care study says why the count matters more than the rate: each extra reminder cut acceptance, and repeats cut it further.9 A test-set number is the demo, and alarms per reader per day is the day. Off-ramp: a pilot you cannot run on your own cases is not a pilot. Write the alarm count down as unknown rather than fill it with the vendor's.
3. Who answers an alarm, and what an answered alarm costs. Name the person and the minutes, and name the action that follows: a second look, a repeat scan, a transfer, a biopsy. The preprint frames its own goal as balancing the cost of false positives against the cost of false negatives, and that is the right frame.2 Seven false flags in ten at a cheap alarm can be a fair price. Seven in ten at a stroke transfer is not. The mammography precedent is what an unowned alarm looks like: the bill went to the women.12 Off-ramp: when the alarm is a worklist reorder and the radiologist reads every study regardless, the answer costs seconds. Then the false share is not the bill, and the check passes on its own.
4. The rate at one month, and again by month seven. Re-measure the false share and the alarms per reader at both points, and keep one more count: readers who stopped responding. The timing follows the only trajectory in the evidence. The lung triage staff answered surveys before go-live, at one month and at seven months, and the mood moved each time.7 Recalls of AI devices also cluster early: in a 2025 review of 950 cleared devices, 43.4 percent of recalls came within the first year.14 The second measurement only compares with the first if the setup is on paper, because the runtime is part of the instrument. Off-ramp: a tool with a written exit rule. Google sets the tolerance in advance and disables a check that crosses it.10 When the switch-off rule is signed before the contract, the count of readers who stopped responding is a trigger, not a post-mortem.
What the four numbers are not
They are not a case against triage tools. A worklist reorder that the reader still checks in full is a cheap alarm, and a high false share can be a fair price. The preprint says as much itself.
They are not a peer-reviewed finding. The preprint is a preprint, its authors include a teleradiology group, and its headline number is predicted from a borrowed prevalence, not observed. The arithmetic stands without it.
They are not a claim that staff switch tools off for false alarms as a rule. In imaging the evidence for that is thin: a survey of perceptions, a pathway withdrawn with no reason printed, and a precedent that stayed on. The switch-off is on record in aviation, in software, and on my own floor. That is why the fourth number counts the readers who stopped responding instead of assuming them.
The first number I ask for
I run enterprise AI in production, as Chief Innovation Officer, and I read medical images every day. Today I build the training data from my own reads, train the model on it, test it on cases it has never seen, and ship tools I read with. For any tool that speaks, my first question is not how accurate. It is how often it is right when it speaks here, and what an answered alarm costs.
A tool is validated where it runs, or it is not validated. Run the sum on the brochure in front of you, three times, before the pilot is signed. If an imaging AI is about to meet a ward you answer for, the contact page reaches a reader who has priced that alarm himself.
References
Footnotes
-
Manrai AK, Bhatia G, Strymish J, Kohane IS, Jain SH. Medicine's Uncomfortable Relationship With Math: Calculating Positive Predictive Value. JAMA Internal Medicine 174(6):991-993, 2014. 14 of 61 clinicians gave the correct answer (23 percent), against 11 of 60 (18 percent) in the 1978 study by Casscells and colleagues, as reported here. Median answer 66 percent against a true 1.96 percent. A convenience sample with no response rate. https://pmc.ncbi.nlm.nih.gov/articles/PMC4955674/ ↩
-
Sparnon E, Stevens K, Song EC, Harris RJ, Strong BW, Bruno MA, Baird GL. The false positive paradox: Examining real-world clinical predictive performance of FDA-authorized AI devices for radiology using clinical prevalence. medRxiv (preprint, not peer reviewed), posted 27 March 2026. Of 57 entries from 38 devices, 91 percent gave sensitivity and specificity, 10 percent explicitly reported PPV and NPV, 19 percent explicitly reported prevalence and a further 51 percent implied it. A detector at 90.6 percent sensitivity and 88.8 percent specificity has a predicted false discovery rate of 70.7 percent at 4.87 percent prevalence. The one-in-ten figure at a test set about half positive and the 11 in 100 tipping point are this article's own arithmetic from the same inputs. https://www.medrxiv.org/content/10.64898/2026.03.25.26349197v1.full-text ↩ ↩2 ↩3 ↩4
-
Dozois A, Hampton L, Kingston CW, Lambert G, Porcelli TJ, Sorenson D, Templin M, VonCannon S, Asimos AW. PLUMBER Study (Prevalence of Large Vessel Occlusion Strokes in Mecklenburg County Emergency Response). Stroke, 2017. Large vessel occlusion was 4.87 percent of an EMS population screened for stroke. https://doi.org/10.1161/strokeaha.117.018925 ↩
-
Hoffrage U, Gigerenzer G. Using natural frequencies to improve diagnostic inferences. Academic Medicine 73(5):538-540, 1998. Physicians estimated PPV correctly in 10 percent of problems given as probabilities and 46 percent given as natural frequencies. https://doi.org/10.1097/00001888-199805000-00024 ↩
-
Del Gaizo AJ, Del Gaizo JK, Shahoumian TA. Radiologist Perceptions of an AI Tool for Intracranial Hemorrhage Detection in Teleradiology: Cross-Sectional Survey Study. JMIR Human Factors, 2026. Of 65 radiologists, 18.5 percent agreed false-positive alerts were infrequent enough to be acceptable and 33.8 percent agreed false-positive review time outweighed the benefits. One network, self-report, no behaviour measured. https://doi.org/10.2196/92145 ↩
-
Perkins A. Ethical AI in Radiology: Performance, People, and Post-market Responsibility (report of S. C. Shelmerdine, European Congress of Radiology 2026). EMJ Radiology, 17 April 2026. An AI-supported lung cancer triage pathway cut average X-ray to CT time from 6 to 3.6 days and was later withdrawn in 2025. The report states no reason. Staff feedback largely negative at one month, more balanced by month eight. https://www.emjreviews.com/radiology/congress-review/congress-feature-ethical-ai-in-radiology-performance-people-and-post-market-responsibility-j14126/ ↩
-
Togher D, Dean G, Moon J, Mayola R, Medina A, Repec J, Meheux M, Mather S, Storey M, Rickaby S, Abubacker MZ, Shelmerdine SC. Evolution of radiology staff perspectives during artificial intelligence (AI) implementation for expedited lung cancer triage. Clinical Radiology, 2025. Staff surveys before implementation, at one month and at seven months moved from apprehension through frustration with technical integration to a more balanced view. Response rates 23.1, 14.9 and 27.2 percent. https://doi.org/10.1016/j.crad.2024.09.010 ↩ ↩2
-
Elías-Cabot E, Romero-Martín S, Raya-Povedano JL, Rodríguez-Ruiz A, Álvarez-Benito M. AI-based triage and decision support in mammography and digital tomosynthesis for breast cancer screening: a paired, noninferiority trial. Nature Medicine 32(4):1296-1305, 2026. In 31,301 women, radiologist workload fell 63.6 percent, cancer detection rose 15.2 percent, and recall rose 14.8 percent and was not noninferior. PPV of recall 13.19 against 13.23 percent. https://www.nature.com/articles/s41591-026-04277-x ↩
-
Ancker JS, Edwards A, Nosal S, Hauser D, Mauer E, Kaushal R. Effects of workload, work complexity, and repeated alerts on alert fatigue in a clinical decision support system. BMC Medical Informatics and Decision Making, 2017. Among 112 primary care clinicians, reminder acceptance dropped 30 percent per additional reminder per encounter and 10 percent per five-point rise in the share of repeated reminders. No desensitization over time was found. Decision support in the record, not imaging AI. https://doi.org/10.1186/s12911-017-0430-8 ↩ ↩2
-
Sadowski C, Aftandilian E, Eagle A, Miller-Cushon L, Jaspan C. Lessons from Building Static Analysis Tools at Google. Communications of the ACM 61(4):58-66, 2018. Review-time checks may carry up to 10 percent effective false positives, defined as issues after which developers took no action. An analyzer is disabled when its not-useful ratio exceeds 10 percent. https://cacm.acm.org/magazines/2018/4/226371-lessons-from-building-static-analysis-tools-at-google/pdf ↩ ↩2
-
Lacagnina M. Silenced for Crying Wolf. AeroSafety World (Flight Safety Foundation), 22 September 2024. In a fatal Twin Otter crash in Nepal the pilot in command had disabled the terrain awareness and warning system because of nuisance warnings. The crew received one ground-proximity alert before the aircraft struck a ridge, and all 22 aboard died. https://flightsafety.org/asw-article/silenced-for-crying-wolf/ ↩
-
Fenton JJ, Taplin SH, Carney PA, Abraham L, Sickles EA, D'Orsi C, Berns EA, Cutter G, et al. Influence of computer-aided detection on performance of screening mammography. New England Journal of Medicine 356:1399-1409, 2007. 43 facilities, seven adopting the tool during the study. Specificity fell from 90.2 to 87.2 percent, PPV from 4.1 to 3.2 percent, biopsies rose 19.7 percent, cancer detection 4.15 against 4.20 per 1,000, unchanged. https://doi.org/10.1056/NEJMoa066099 ↩ ↩2
-
Lehman CD, Wellman RD, Buist DSM, Kerlikowske K, Tosteson ANA, Miglioretti DL. Diagnostic Accuracy of Digital Screening Mammography With and Without Computer-Aided Detection. JAMA Internal Medicine 175(11):1828-1837, 2015. Performance was not improved with computer-aided detection on any metric assessed. The tool was used for most screening mammograms in the United States and cost over 400 million dollars a year. https://doi.org/10.1001/jamainternmed.2015.5231 ↩
-
Lee B, Kramer P, Sandri S, et al. Early Recalls and Clinical Validation Gaps in Artificial Intelligence-Enabled Medical Devices. JAMA Health Forum 6:e253172, 2025. Of 950 devices, 6.3 percent had recalls and 43.4 percent of recalls came within 12 months. https://jamanetwork.com/journals/jama-health-forum/fullarticle/2837802 ↩